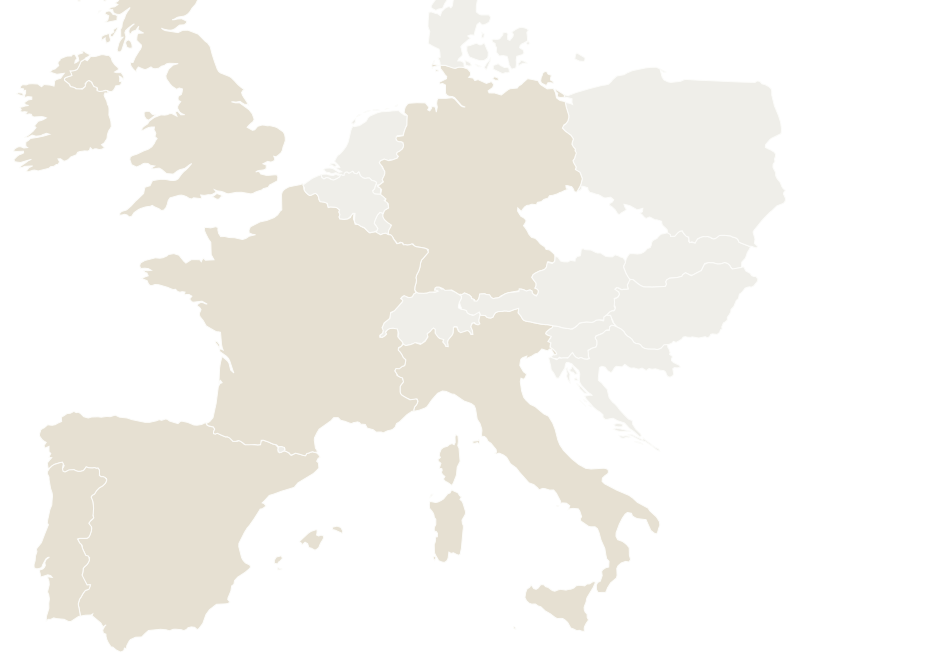
What this map is
The European Powered-Land Map tracks 62 verified brownfield sites with existing grid connections across 7 European countries — Spain, Portugal, Italy, France, Germany, the United Kingdom and Ireland — including 17 Tier-A sites and 25 in court-run insolvency processes with defined timelines.
Powered land is land with a secured, near-term path to the megawatts a data center needs — where the power is solved before construction begins. It can be greenfield or brownfield; the fastest is brownfield — idled or operating industrial sites whose existing high-capacity connection can be energized in months, while a new grid application in Europe sits in the interconnection queue for years. The connection, not the land, is the scarce asset. This map is the public, redacted view of the brownfield powered land Ampervia originates and verifies node by node — because an old connection is a lead, not proof, and confirming it is the whole job.
Coverage by country
| Country | Verified sites | Tier-A | Metro zones | Zones |
|---|
| Spain | 25 | 4 | 3 | Valencia, Barcelona, A Coruña |
| Italy | 16 | 3 | 3 | Milan, Rome, Florence |
| Germany | 10 | 4 | 4 | Dresden, Munich, Mannheim, Essen |
| France | 7 | 5 | 5 | Lyon, Dijon, Bordeaux, Nantes, Lille |
| Portugal | 2 | 1 | 2 | Porto, Setúbal |
| United Kingdom | 1 | — | 1 | Glasgow |
| Ireland | 1 | — | 1 | Dublin |
Coverage by metro zone
The Ampervia Screen — how a site qualifies
We don't screen public grid data and stop there — we originate off-market powered land and verify it node by node. Every site on the map passes the Ampervia Screen, a four-layer discipline applied in sequence before a site earns a score. The map is deliberately thin because it is filtered, not because the screen is small.
- Layer 1 · Energy-collapse evidence — emissions registries showing the industrial load has genuinely stopped or stepped down, so the connection is truly freed.
- Layer 2 · Process records — insolvency and court filings, land records, and administrator processes that define who can transact and on what timeline.
- Layer 3 · Grid watch — system-operator capacity publications tracked monthly across thousands of transmission and distribution nodes, so a site's connection status is current, not archival.
- Layer 4 · Ampervia Score — sites that survive Layers 1–3 are scored and ranked, then tiered by verification depth (Tier-A is the strongest) and re-checked monthly.
How the Ampervia Score works
Each site row carries an Ampervia Score out of 100 — Layer 4 of the Ampervia Screen. It is a modeled composite of five weighted factors — power headroom 25%, permit climate 20%, process clarity 20%, verification depth 20%, return profile 15%. A factor with no reliable input is excluded and the remainder re-weighted, never guessed. Because every mapped site has already passed Layers 1–3, the Score ranks qualified sites rather than flagging risk; a qualified site starts well above the midpoint and only sites strong on every factor approach the 90s. It is an origination signal — not a valuation and not an offer.
Frequently asked questions
What is powered land?
Powered land is land with a secured, near-term path to the megawatts a data center needs — the power solved before construction begins. The fastest is brownfield: idled or operating industrial sites whose existing high-capacity connection can be energized in months, not the years a new grid application waits in the queue.
Why are site identities not shown?
Identities and the full per-site dossier are released with Ampervia Pro membership, under its confidentiality and non-circumvention agreement. The public map shows aggregates and coded rows; the gated ledger adds per-site economics. This protects the owners, the processes, and the buyer's position.
How do I get the full ledger?
Register free at platform.ampervia.com with a work email and a confidentiality and non-circumvention undertaking. That opens the full redacted ledger and per-site scored briefs.
Open the full redacted ledger →
What this map is
This map shows Ampervia's verified off-market powered-land sites in the US — idled industrial sites (steel mills first) whose existing grid connection a data center can inherit, skipping the multi-year interconnection queue. It is early inventory and deliberately sparse: each dot is a site we've verified as genuinely off-market, shown at region level (never the exact parcel), and it grows as verification completes.
Powered land is land with a secured, near-term path to the megawatts a data center needs. The scarce asset is the connection, not the land — so we source industrial sites that have quietly idled or downsized, freeing a large existing grid tie. Identities, connection detail and the full dossier are released with Ampervia Pro.
Verified sites
How a site earns its place here
Each site has cleared the first layers of the screen — verified as genuinely off-market (quietly idled, not a contested public closure) with an existing grid connection. Under engagement we complete verification per site:
- Confirm the connection — that the existing grid tie is real, sized for import, and reusable for large load (not just self-generation).
- Map the process — ownership, site control, and the path to acquire or partner.
- Grid path — the interconnection-reuse route with the utility and system operator, and a realistic energization timeline.
- Rank — a site earns an Ampervia Score only once the first three hold.
The public map is deliberately coarse — region level, never the exact parcel; the detail is released under engagement.
Frequently asked questions
What does the US map show?
Ampervia's verified off-market powered-land sites in the US — idled industrial sites whose existing grid connection a data center can inherit. Shown at region level (not exact parcels). Early inventory, growing as verification completes.
Why region-level and not exact parcels?
Redaction — the same as Europe. Each dot is a real verified site shown at region level so it can't be identified publicly; the exact parcel, owner and connection detail are released with Ampervia Pro.
How is this different from the European map?
Same treatment now — both show verified off-market sites, redacted and register-gated per site. Europe is a larger, more mature inventory; the US set is early and steel-led, because steel mills (EAF and integrated) carry the largest grid connections a data center can inherit.
How do I get site-level access?
Register free at platform.ampervia.com with a work email, then step up to Ampervia Pro for identities and full dossiers; a per-site mandate takes a site to executable.
Verified off-market industrial sites, shown at region level (never the exact parcel). Each is confirmed genuinely off-market with an existing grid connection; import-connection sizing is completed under a per-site mandate, and identities with full dossiers are released with Ampervia Pro. Inventory is early and grows as verification completes.
Open the full redacted ledger →